Debugging
Overview
Teaching: 30 min
Exercises: 15 minQuestions
What do I do to find out why my code failed?
Are debuggers just for compiled languages?
Why are debuggers hard to use?
Objectives
Use a variety of options from compiler options to full blown commerical debuggers to discover an issue with the code.
Understand how Python can be debugged with Pdb.
Use the correct tool to debug the relevent issue.
Bugs! Software is very hard to write without them so skills to squash them is required. For compiled languages, e.g. C/C++/Fortran there is much that can be done at compile-time to highlight issues, as well as at runtime. For other languages, e.g. Python, issues are only highlighted at runtime. For HPC, highlighting issues at runtime can mean wasted resources.
Bugs
Some examples of bugs are:
- Unexpected error (Segmentation fault, crashes)
- Different results (even crashes) on different systems or number of processors.
- Change does more than it was supposed to do.
Print statements can be useful but can take time, and adding code can change behaviour of the program and the bug can change or disappear.
Compiled languages
Most compilers have methods to detect issues at compile-time. These are usually recommendations due to non-compliance of standard or type conversion. There is also options enabled at compile time to help debugging at runtime.
GNU/GCC
GNU compilers have a number of options. Using gfortran as an example (gcc and g++ share options).
To turn on debug symbols, adds line number of source file information:
$ gfortran -g main.f90
To turn traceback to highlight where the program crashed. Provides line number of source file.
$ gfortran -fbacktrace main.f90
To force a strict standard compliance reduces issues due to compiler specific options being used that harms portability.
$ gfortran -std=f95 main.f90
To strictly look for issues in code
$ gfortran -std=f95 -pedantic -Wall main.f90
Intel
Intel Compilers have similar options to GNU. Using ifort as an example (most options shared between other compilers
icc and icpc.
To turn on debug symbols, adds line number of source file information:
$ ifort -g main.f90
To turn traceback to highlight where the program crashed. Provides line number of source file.
$ ifort -traceback main.f90
To force a strict standard compliance reduces issues due to compiler specific options being used that harms portability.
$ ifort -std95 main.f90
To strictly look for issues in code
$ ifort -C main.f90
Demonstration
Download the files
$ wget https://arcca.github.io/hpc-advanced/files/debug1/Makefile
$ wget https://arcca.github.io/hpc-advanced/files/debug1/main.f90
Look at the
Makefile, can you change the compilation options to turn on some of the compiler options. Update the time onmain.f90withtouch main.f90- runmakeagain. Try switching compilers and see how debug options work.Solution
The options should help identify issues. Updating the file should rebuild the executable. Just explore!
System settings
There are a few settings that can control the behaviour when compiled languages are run these are set using the ulimit
option.
To set the limit of core dumps (files generated when a program crashes) use
$ ulimit -c unlimited
To set the limit of the stack memory (important for Intel Fortran Compiler)
$ ulimit -s unlimited
Debuggers
There are a number of tools that can be used to look at problems at runtime for compiled codes such as gdb or ARM
Forge DDT.
gdb
Compile with -g to include debug symbols. Then run
$ ifort -g main.f90
$ gdb ./a.out
(gdb) run
gdb can usually be found where GNU compilers are available. It is very useful to print out other variables near to where the program crashes.
ARM Forge
ARM Forge contains a commercial debugger. It is loaded with a module
$ module load arm-forge
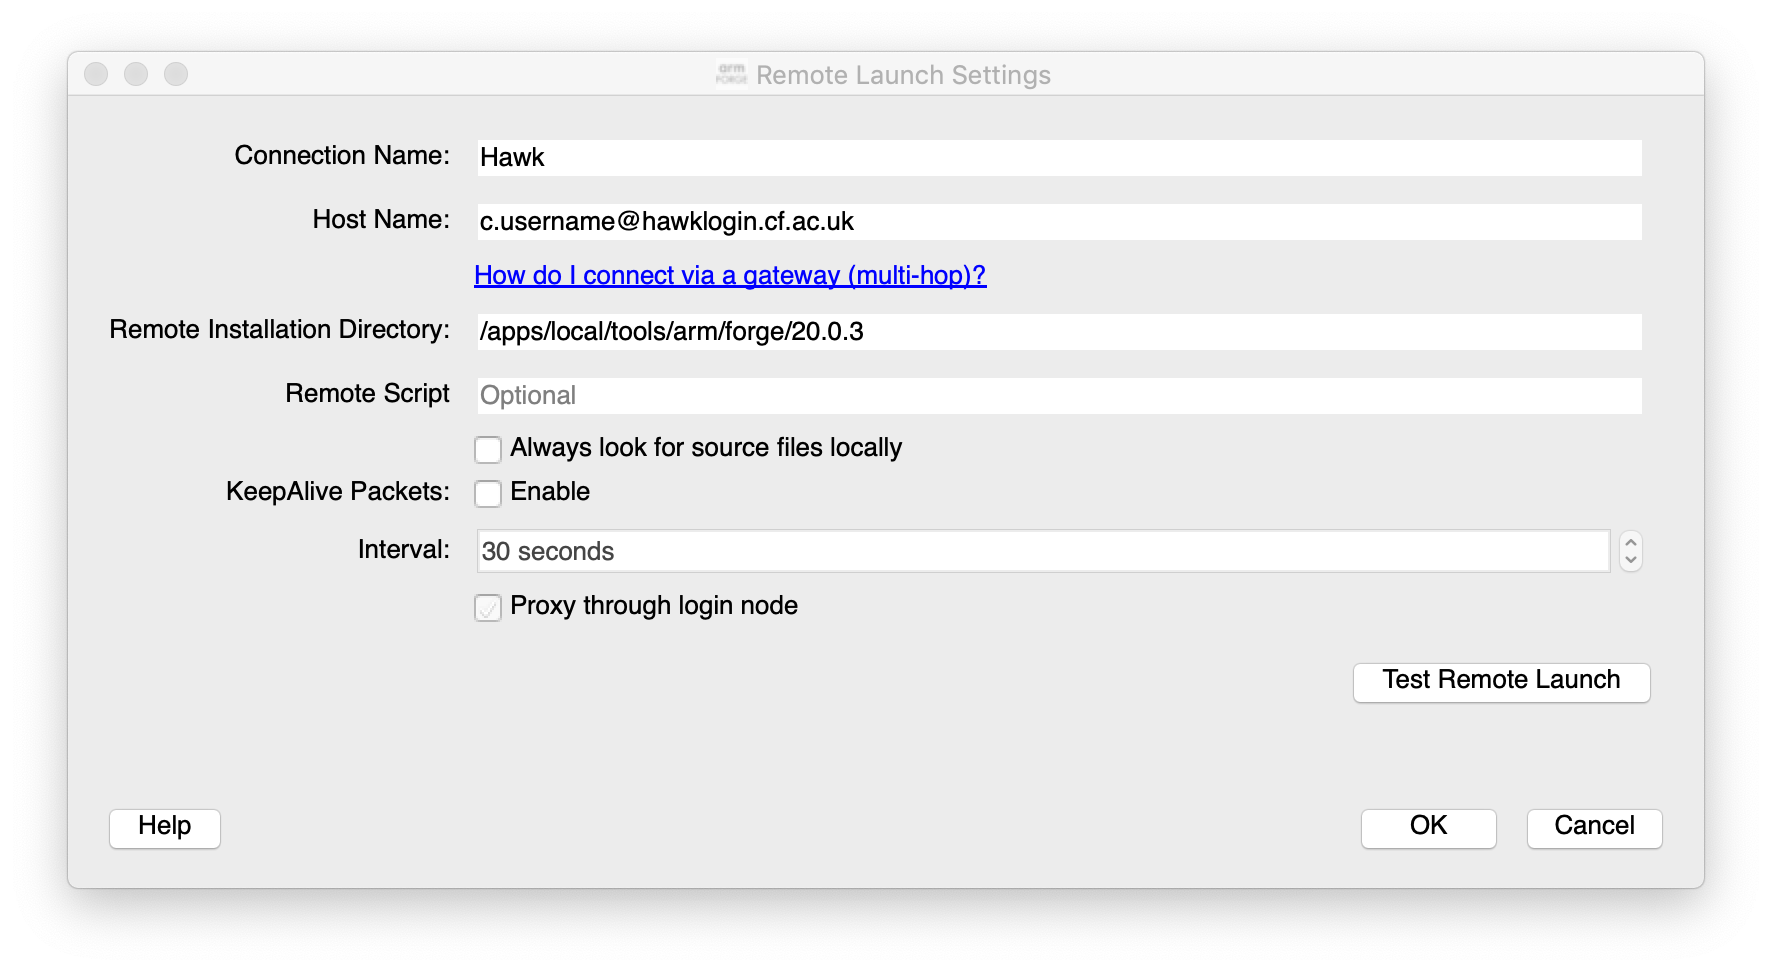
It is recommended to run the graphical debugger by installing the GUI interface on your local machine and connect remotely to Hawk via the software. A download from ARM website and look at the links in Remote Client Downloads
After installing the client you can setup a connection to Hawk using standard SSH connections and pointing to the Hawk
location for the version of ARM Forge, e.g. /apps/local/tools/arm/forge/20.0.3
Options can be set for the job scheduler
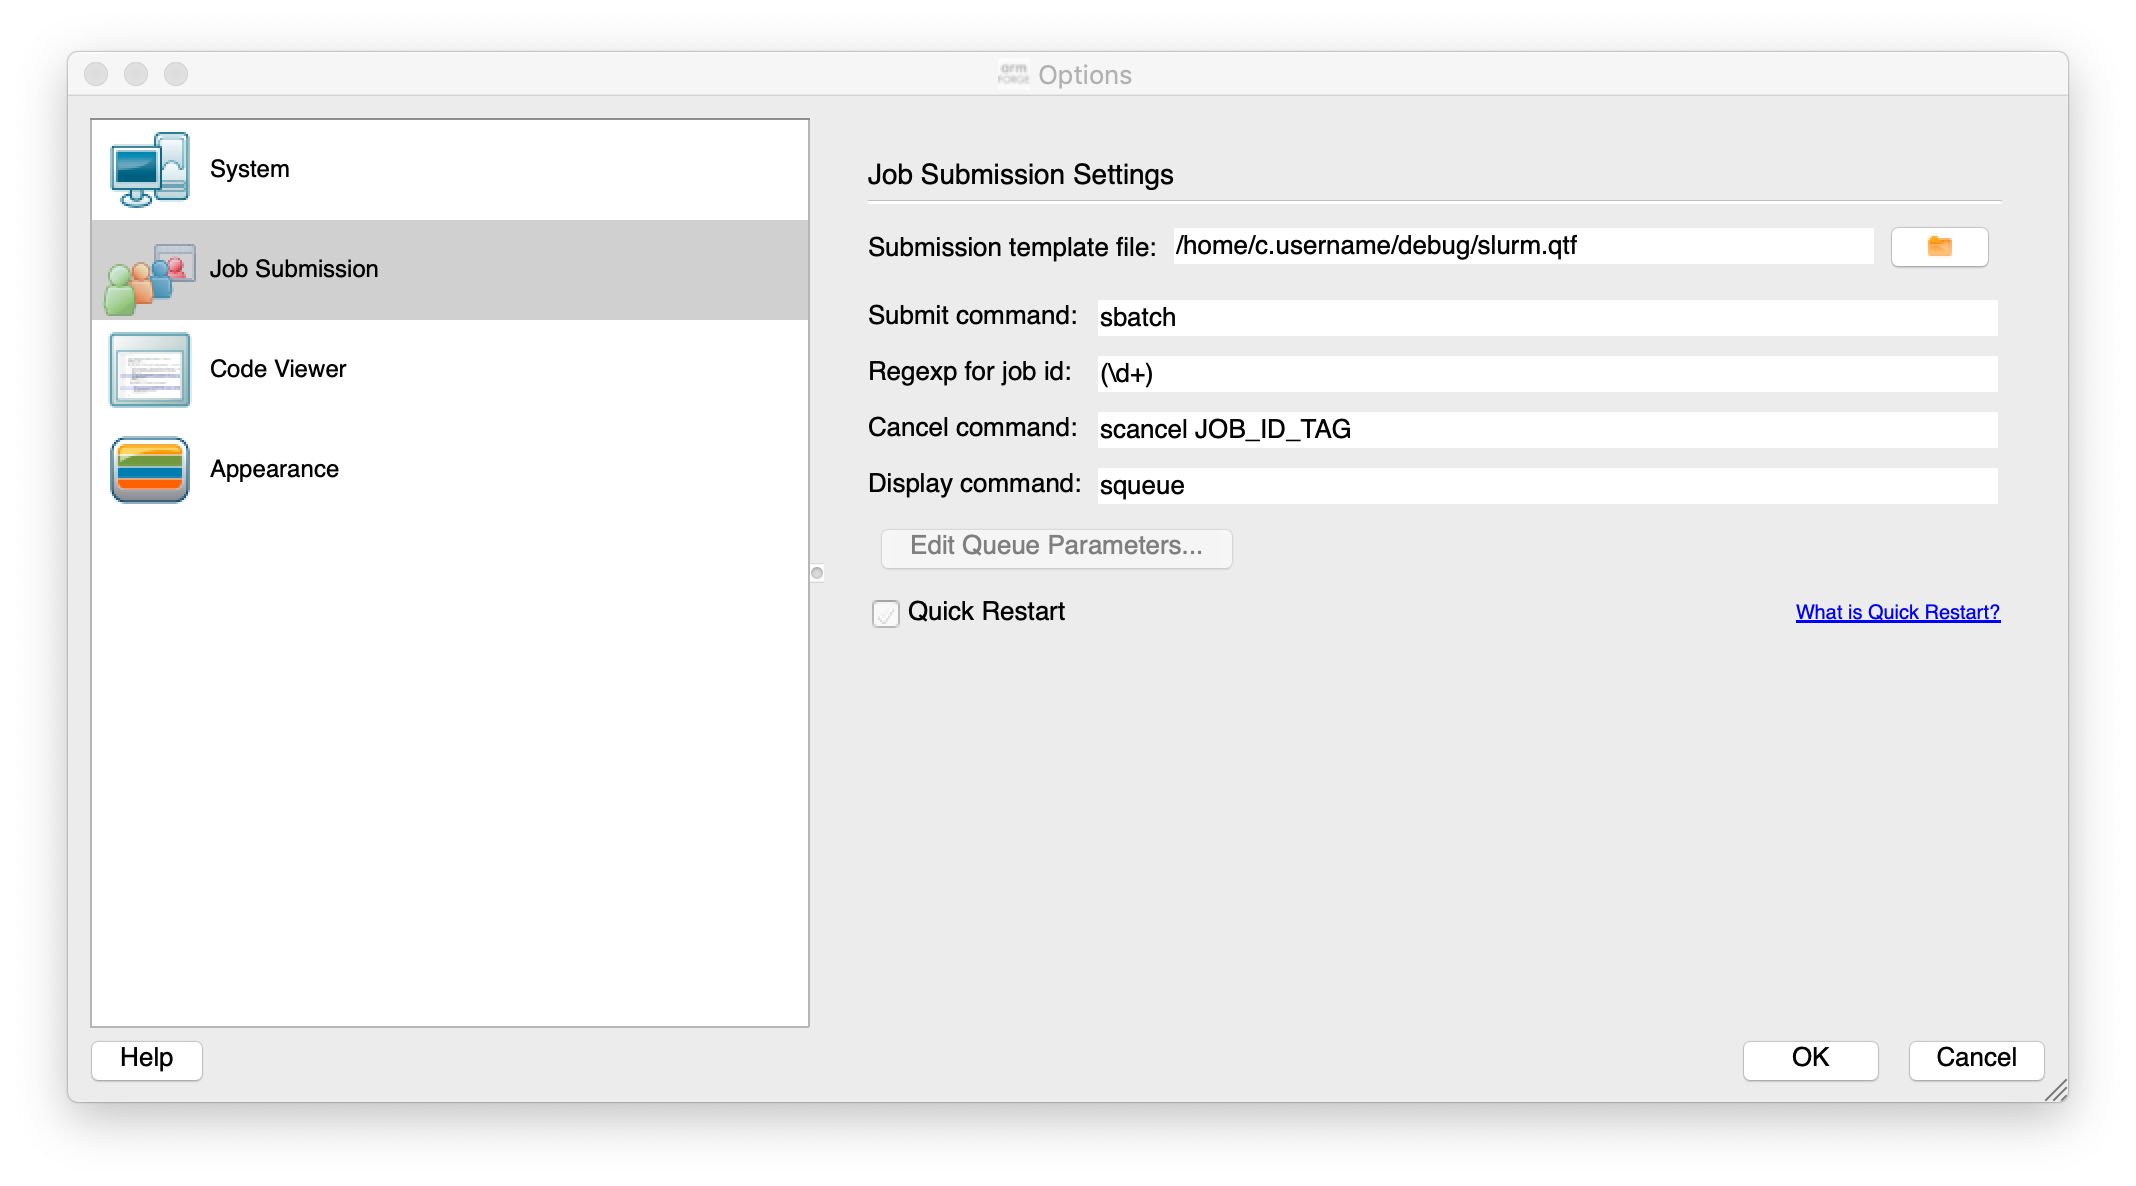
The important file to make sure it works is the template job submission script file. This is the file
/home/c.username/debug/slurm.qtf in the figure above and can be downloaded with
$ wget https://arcca.github.io/hpc-advanced/files/debug2/slurm.qtf
This can then be run and will be submitted to the queue and will then connect back to your desktop to allow you to step through the software.
If interested please get in touch if further help is required.
Python debugger Pdb
Python is already good at providing information on errors. If the program is not providing the correct answers then debugging would be useful.
The Pdb module is very useful for tracking program flow in Python and printing out variables to check state of the program.
Very similar to gdb.
To invoke Pdb, it can be applied to a Python script
$ python3 -m pdb myscript.py
Or near a location that requires by inserting in the Python script
import pdb; pdb.set_trace()
Demonstration
Download the files
$ wget https://arcca.github.io/hpc-advanced/files/debug3/Makefile
$ wget https://arcca.github.io/hpc-advanced/files/debug3/main.f90
$ wget https://arcca.github.io/hpc-advanced/files/debug3/main.py
Compile the program with
make. Try running inside a debugger.Solution
Use
makeandgdbto explore the error. Usepdbfor Python.
Working with job schedulers
When running a debugger it can either be interactive or non-interactive. Interactive will require the job scheduler to
give you resource fairly quickly so a small example of the bug that requires small amount of resource will allow it to
queue less on Hawk. The dev partition can be used for short running jobs.
SLURM can provide an interactive session with
$ srun -n 1 -p compute --account=scwXXXX --pty bash --login
This will provide the user with a bash shell on the partition selected, e.g. compute in example above.
For non-interactive jobs, the debugger can be supplied with a script to print traceback or print a variable when it crashes. A core file can also be produced which contains a snapshot of memory at the point of crashing.
If software compiled with Intel compiler the following environment variable can be set in the job script before the program is run.
$ export decfort_dump_flag=y
This will produce a core file core.XXXX where XXXX is the process id of the crashed program.
A debugger such as gdb can be run on a login node with the executable and core file.
$ gdb ./a.out core.XXXX
Demonstration
Download the files
$ wget https://arcca.github.io/hpc-advanced/files/debug4/Makefile
$ wget https://arcca.github.io/hpc-advanced/files/debug4/main.f90
Look at the
Makefile, can you check that the compilation options to turn on some of the compiler options. See what happens when it is run.Solution
Set
decfort_dump_flag=yto create a core file and run withgdb ./a.out core.XXXX
Intel Inspector
OpenMP is a popular technique to parallelise code due to its simple method of using compiler directives to guide the compiler.
More information on OpenMP
We provide training on OpenMP for users wanting further information on how to use it. Please check recent training notices.
The easy nature of adding OpenMP can also lead to common mistakes such as race conditions on threads reading and writing to the same variable. Intel Inspector checks the code for threading issues. An example of it highlighting possible issues can be found in the Github issue for the COVID-19 CovidSim microsimulation model developed by the MRC Centre for Global Infectious Disease Analysis.
Intel Inspector can be loaded with the module intel-psx
$ module load intel-psx
This loads the complete Intel Parallel Studio software suite.
Then the application, e.g. my_app.exe, you want to debug can be run with
$ inspxe-cl -collect ti2 -result-dir ./myResult1 -- my_app.exe
This will output the collected data from the application in myResult1 directory. The -collect option can be varied
depending on what needs to be collected.
$ inspxe-cl -collect-list
Available analysis types:
    Name  Description
    mi1   Detect Leaks
    mi2   Detect Memory Problems
    mi3   Locate Memory Problems
    ti1   Detect Deadlocks
    ti2   Detect Deadlocks and Data Races
    ti3   Locate Deadlocks and Data Races
Intel Inspector is currently free at time of writing but it can be run remotely n Hawk. Due to the GUI it is recommended to request access to the VNC server (a more efficient method of running graphical windows from a remote machine).
$ inspxe-gui
And load the files generated from the collection stage.
If further information is required please get in touch.
Summary
This has been a short introduction to debuggers and common methods to analyse and identify the bug to fix.
Key Points
Bugs can come in all shapes and sizes, know your tools!